此内容暂无简体中文译文,以下为英文原文。
Historical February 1985 report or notice. Original dates, prices and contacts describe the source period; current availability has not been established.
Two surveys have recently been conducted in Skinker-DeBaliviere concerning the street barrier placed at Delmar and Des Peres.
In reporting here the results of both surveys, The Times has deleted as many questions as possible for which there is no comparable question in the other survey. (For example, one survey asked “how long have you lived in the neighborhood?” The other survey did not.) For purposes of clear comparison, we have tried to stick to the issues covered by both surveys. Interestingly, two very different methods were used to obtain opinions.
The methods are briefly described below.
It should also be noted that the number of households surveyed (the sampling) differs significantly.
This has in all likelihood had an important effect on the results. Of course, as we all know, it is nearly impossible to have an unbiased poll. How questions are asked and who asks them are important parts of analyzing the results.
Here it must be pointed out that there is built-in bias in both surveys.
The UMSL/Washington Heights Neighborhood Association phone surveyors began their calls by saying, “I am conducting a survey in cooperation with the University of Missouri-St. Louis and the Washington Heights Neighborhood Association. I would like to ask your opinion concerning street barriers in your neighborhood.” The other survey was mailed by Operation SafeStreet and contained some statistics concerning crime, as well as some positive feedback about the SafeStreet program.
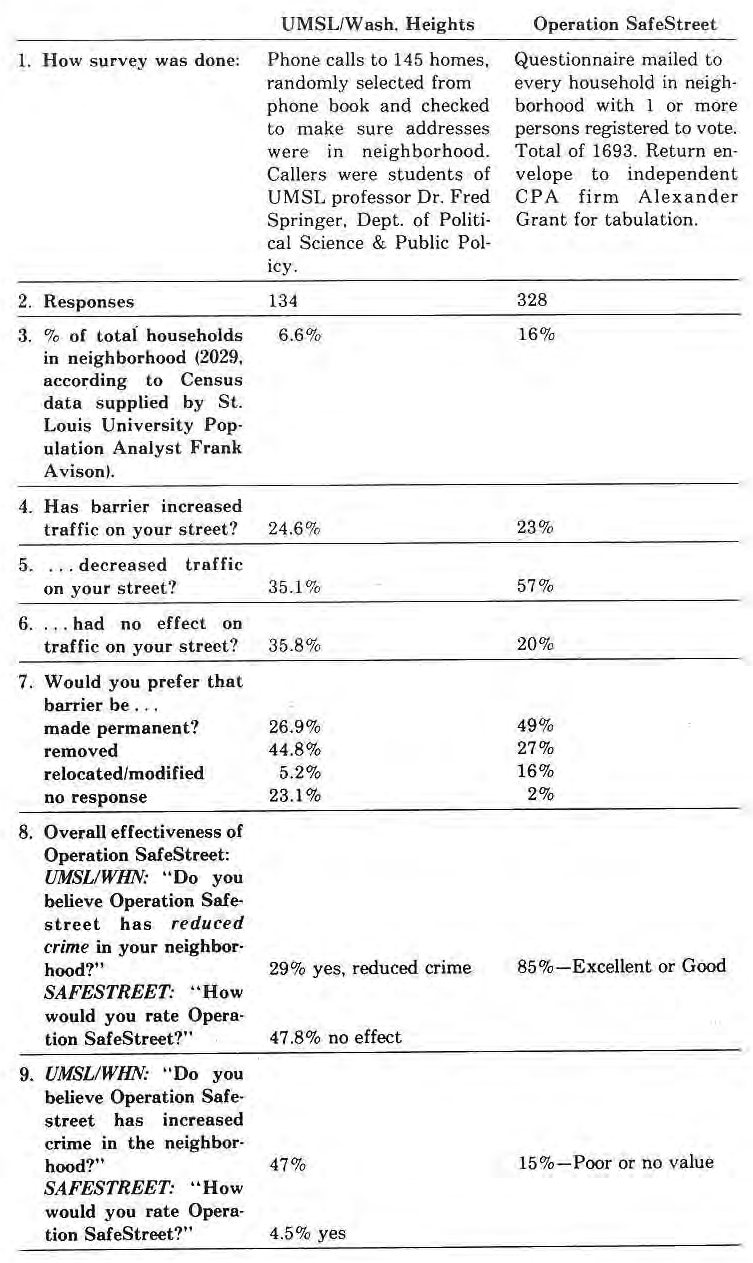
1. How survey was done. UMSL/Wash. Heights: Phone calls to 145 homes, randomly selected from phone book and checked to make sure addresses were in neighborhood. Callers were students of UMSL professor Dr. Fred Springer, Dept. of Political Science & Public Policy. Operation SafeStreet: Questionnaire mailed to every household in neighborhood with 1 or more persons registered to vote. Total of 1693. Return envelope to independent CPA firm Alexander Grant for tabulation.
2. Responses. UMSL/Wash. Heights: 134. Operation SafeStreet: 328.
3. % of total households in neighborhood (2029, according to Census data supplied by St. Louis University Population Analyst Frank Avison). UMSL/Wash. Heights: 6.6%. Operation SafeStreet: 16%.
4. Has barrier increased traffic on your street? UMSL/Wash. Heights: 24.6%. Operation SafeStreet: 23%.
5. …decreased traffic on your street? UMSL/Wash. Heights: 35.1%. Operation SafeStreet: 57%.
6. …had no effect on traffic on your street? UMSL/Wash. Heights: 35.8%. Operation SafeStreet: 20%.
7. Would you prefer that barrier be… UMSL/Wash. Heights / Operation SafeStreet: made permanent? 26.9% / 49%; removed 44.8% / 27%; relocated/modified 5.2% / 16%; no response 23.1% / 2%.
8. Overall effectiveness of Operation SafeStreet. UMSL/WHN: “Do you believe Operation SafeStreet has reduced crime in your neighborhood?” 29% yes, reduced crime; 47.8% no effect. SAFESTREET: “How would you rate Operation SafeStreet?” 85%—Excellent or Good.
9. UMSL/WHN: “Do you believe Operation Safestreet has increased crime in the neighborhood?” 47%; 4.5% yes. SAFESTREET: “How would you rate Operation SafeStreet?” 15%—Poor or no value.
There are obviously wide disparities between the polls on the opinion questions of whether to remove the barriers and whether Operation SafeStreet has had an effect on crime.
There is also information missing, i.e., the actual crime statistics (showing a decrease in crime during 1984—see Council Report elsewhere in this issue). Whether this is a cause and effect correlation, or coincidental; whether people’s opinions are based on any verifiable facts: and whether the barriers matter to enough people, are questions not answered in either survey.
Original photograph caption
Original barricade survey comparison table. The Times of Skinker-DeBaliviere, February 1985, page 7. Different survey questions and an unlabeled 47% are retained as printed.
Originally published in The Times of Skinker-DeBaliviere, February 1985.
Read this article in the original newspaper issue.
Archival transcription note: Printed survey row 9 has an unlabeled 47% alongside 4.5% yes. No answer label inferred. Questions and sampling methods differ; percentages are not equivalent measures or proof of causation.; Later source correction: March 1985, page 4, says the unlabeled 47% was printed in error and should be omitted; 4.5% increased-crime and 15% poor/no-value responses were correct. February table retained as originally printed; consult the March correction.
Original source: SD_Times1985_02.pdf, printed page(s) 7; PDF page(s) 7.
